Broker compensation in group benefits is technically public information. It has been disclosed on Form 5500 filings for decades. But in practice, this data has been one of the hardest datasets in the industry to access, compare, or make sense of.
That is starting to change. For the first time, it is now possible to see broker commission and fee rates by employer, filter by location, industry, carrier, and product line, and benchmark compensation against peer groups — all in one searchable platform. This article explains what the data shows, how it is structured, and why it matters differently for carriers, brokers, and vendors.
Broker compensation in group benefits has been reported on Form 5500 Schedule A and Schedule C for decades. Every year, employers with qualifying benefit plans disclose the commissions, fees, and other compensation paid to their brokers and service providers as part of their annual Department of Labor filing. The data is public. It is not a secret.
But public does not mean accessible. The raw filings are dense, inconsistent, and filed individually per employer — one plan at a time, across hundreds of thousands of filings per year. There is no aggregated, searchable view out of the box. No way to compare one broker’s comp rate against another. No way to filter by geography, industry, carrier, or product line. No way to know whether a given rate is typical or an outlier without pulling filings one by one and doing the math yourself.
This is why broker compensation has remained one of the least understood dimensions of the group benefits market — despite being disclosed every year. Other platforms that work with Form 5500 data typically focus on plan structure, carrier relationships, or employer demographics. The compensation layer has been largely untouched.
Benefeature addresses this gap — not by creating new data, but by making existing public data usable for the first time. The platform aggregates, cleans, and benchmarks broker compensation across every Form 5500 filing, turning scattered disclosure into a searchable, filterable, and benchmarkable dataset.
When broker compensation data is properly aggregated and structured, it reveals a level of market detail that most industry professionals have never had access to. The dataset is richer than a single number — it includes the full compensation structure, broken out across multiple dimensions and available at four distinct levels of detail.
The depth of the data is what sets it apart. Rather than a single aggregate view, compensation data is available at four connected levels — each progressively more granular:
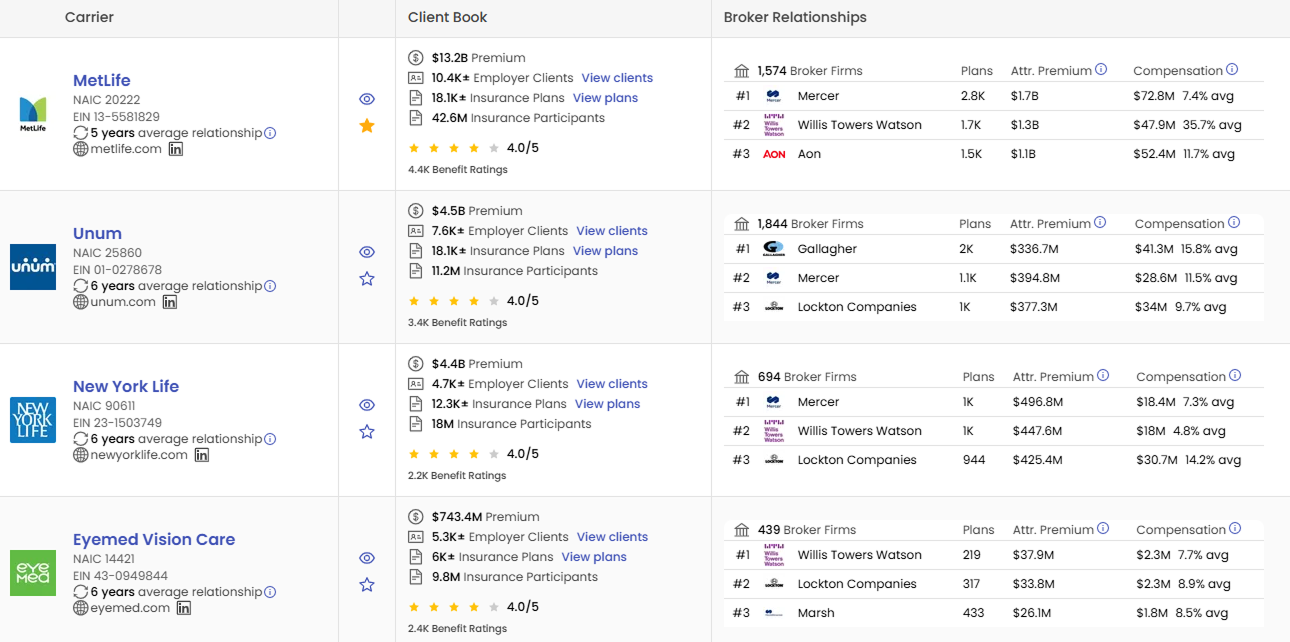
See a carrier’s top broker relationships ranked by plans, attributed premium, and total compensation — both as a dollar amount and as a percentage average. For example, a carrier’s top broker might show 2,900 plans with $1.7 billion in attributed premium and $72.8 million in compensation at a 7.4% average rate, while another broker relationship at the same carrier might show a 35.7% average. That kind of side-by-side comparison was previously impossible without months of manual research.
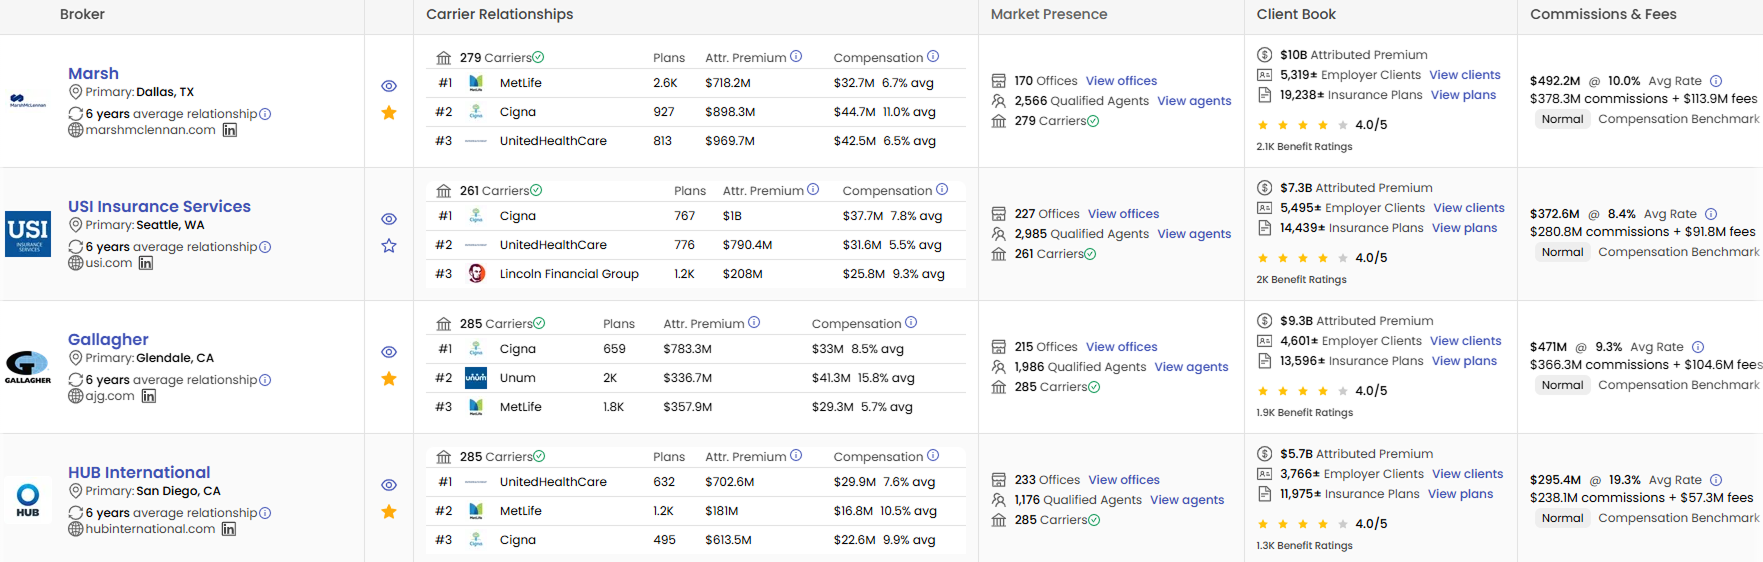
See a broker firm’s full compensation profile: total commissions and fees, average rate, the split between commissions and fees, carrier relationships with attributed premium and comp per carrier, market presence including offices and qualified agents, and a Compensation Benchmark flag. For instance, a national broker might show $482.2 million in total comp at a 10.0% average rate, broken down as $378.3 million in commissions and $113.9 million in fees.
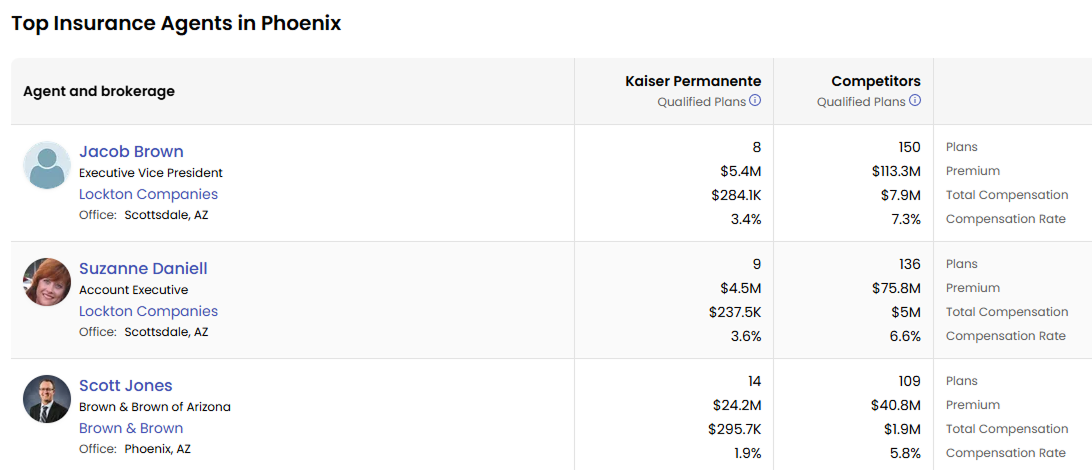
See individual producing agents with their NPN, title, broker firm and office location, contact information, and their qualified book of business — including qualified premium, qualified clients, qualified plans, and their own compensation breakdown with dollar amount, average rate, commissions-versus-fees split, and Compensation Benchmark flag.
.png)
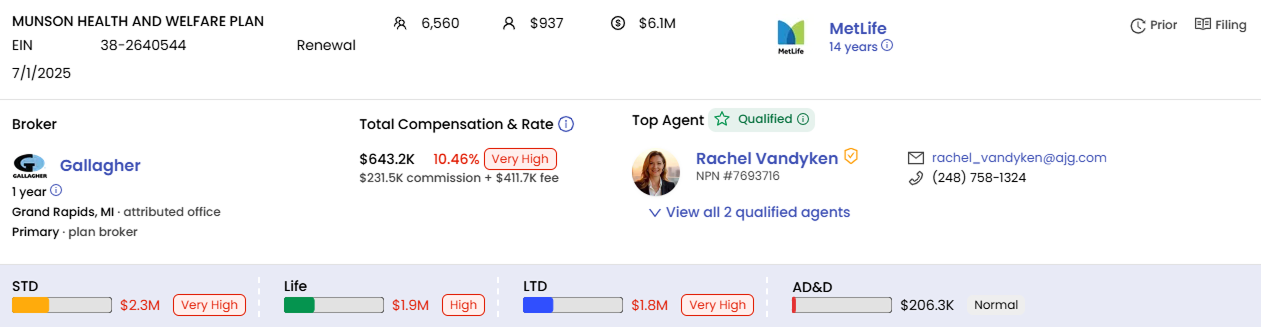
Drill into an individual employer’s plan and see the exact broker, total compensation and rate, the commission-plus-fees breakdown, the benchmark flag, carrier relationship length, and the top qualified agent with contact information. At this level, you might see a specific plan’s broker compensation flagged at 21.28% — with $219.2K in commissions and $14K in fees — alongside the per-product premium benchmarks for that plan.
This connected, multi-level structure is what makes the data useful. You can start at the carrier level to understand broad compensation patterns, drill to a broker firm, see individual agents and their qualified books, and zoom all the way in to a specific employer plan — with compensation benchmarking at every level.
Explore all four levels interactively
See how broker compensation data is structured from carrier down to individual employer plan — with screenshots and walkthroughs at every level.
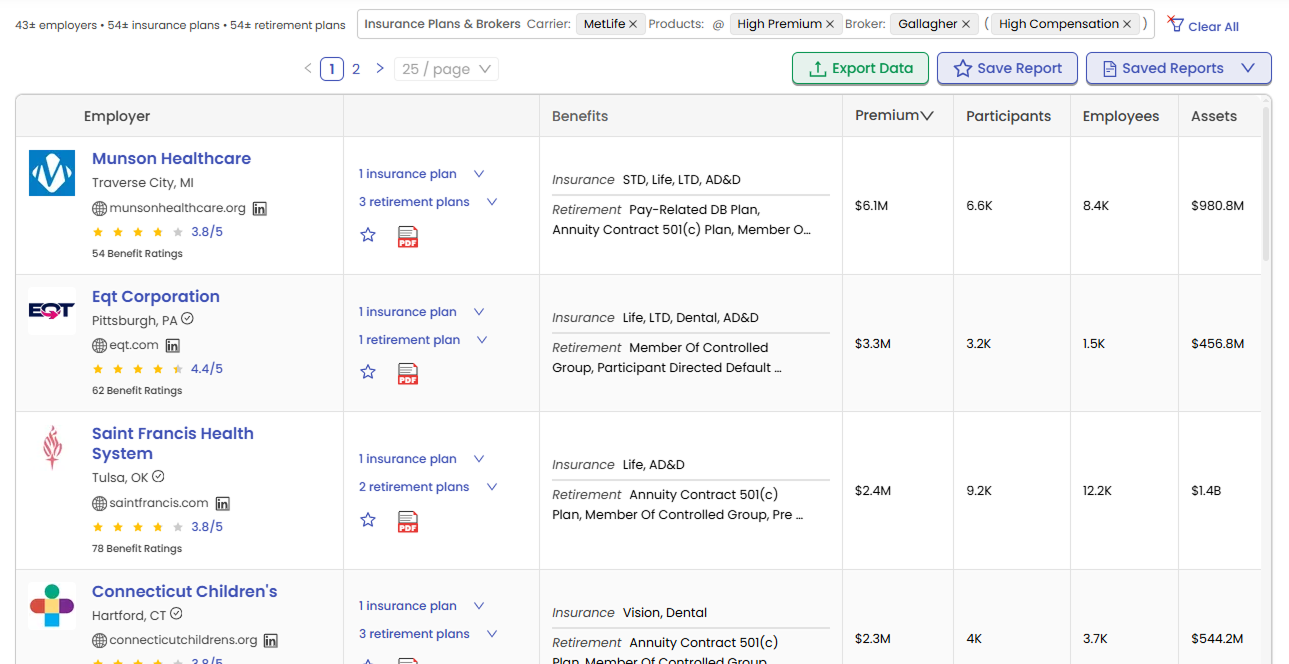
Beyond the multi-level structure, the data is completely searchable and filterable across the platform. You can filter by employer location, industry, products, carrier, qualified agents, and more. Search for a specific broker you are targeting. Search for employers where the broker comp rate is high in Boston, MA. Search for carriers with above-average compensation in a particular product line. The data is not a static report — it is a living dataset you can query from any angle.
Raw numbers alone do not tell you much. A broker earning $15.7 million in compensation sounds like a lot — but is it? Relative to their book size, their market, and their peer group, it might be perfectly normal. Or it might be well above average. Without context, the number is just a number.
This is where compensation benchmarking comes in. Every broker compensation rate on the platform is compared against similar plans and flagged on a five-level scale:
Compensation Benchmark Distribution
.png)
The benchmark compares each rate against peer groups defined by employer size, geography, industry, and product mix. A large national broker might show “Normal” at the aggregate level — meaning their 10.0% average rate is in line with comparable firms. Meanwhile, an individual employer plan under a different broker might be flagged “Very High” at 21.28%. Both are useful signals at different zoom levels.
The benchmark is context, not judgment. A “Very High” flag does not mean something is wrong — it means the rate is statistically above the peer group average. A “Normal” flag means the rate is in line with comparable plans. The flag gives you the starting point for a conversation, not the conclusion.
The benchmark flag appears inline next to the compensation figure at every level — carrier, broker firm, employer plan, and individual agent. You do not need to export data and run a separate analysis. The context is built into the view.
See how benchmarking works
Walk through the five-tier benchmark system and see how comp rates are flagged in context on the Broker Compensation Intelligence page.
Broker compensation is not a single number. When you look at what brokers actually receive, the compensation structure is more nuanced than most people realize. Form 5500 filings disclose different types of fees and compensation that brokers earn for the same plan, and these fee types tell a story about how the broker relationship is structured.
A broker who earns a commission on premium volume has a different economic relationship with the employer and carrier than a broker who charges a flat consulting fee for plan design advisory. A broker receiving an override fee from a carrier for meeting volume thresholds has a different dynamic than one earning a TPA fee for handling claims administration. And a single broker can receive multiple fee types for the same plan.
Understanding these distinctions matters. For carriers evaluating distribution economics, the fee type composition of a broker relationship reveals how that broker generates revenue and where their incentives lie. For brokers preparing for ERISA transparency conversations, being able to articulate the specific types of compensation you receive — and how they compare to peers — is increasingly important. For vendors, broker fee type patterns are a signal about market segment dynamics and partnership potential.
Benefeature classifies broker compensation from Form 5500 filings into 14 distinct fee types. Each is searchable and filterable across the platform:
The standard percentage of premium paid by the carrier to the broker for placing and servicing the plan. This is the baseline compensation model in group benefits.
A flat or percentage-based fee charged by the broker for ongoing account servicing, plan administration support, or advisory services — often decoupled from commission in large-group or self-funded arrangements.
An additional commission payment above the standard rate, typically paid for meeting specific performance targets, volume thresholds, or preferred distribution agreements with the carrier.
A carrier payment to the broker above standard commission, usually tied to aggregate firm performance, market share goals, or strategic partnership status. Often paid at the firm level rather than per-plan.
Performance-based compensation from the carrier, typically tied to persistency (retention rates), growth targets, profitability, or other measurable outcomes over a defined period.
Compensation that is conditional on future events or performance metrics — for example, a bonus that only pays if retention exceeds a threshold, or if the broker hits a premium volume target.
A fee related to marketing, distribution, or promotional activities. Often seen with carriers for specific product lines, especially voluntary and supplemental products, reflecting the broker’s role in product distribution beyond standard advisory.
A fee paid to a General Agent (GA) or Managing General Agent (MGA) for their role in recruiting, managing, and supporting a network of sub-agents or brokers under their appointment.
A fee associated with Third Party Administrator services, where the broker or an affiliated entity handles claims administration, plan management, or other administrative functions beyond traditional brokerage.
A fee for technology services, tools, or platforms provided by the broker to the employer or carrier — such as benefits portal access, enrollment platforms, or data analytics tools.
A fee for strategic benefits consulting, plan design, vendor evaluation, actuarial analysis, or other advisory services that go beyond standard brokerage and servicing. Often charged by larger brokerages to employers who want advisory decoupled from carrier commissions.
A fee paid by one broker or entity to another for referring business or clients. Common in broker networks or when one firm sources a client and another firm services it.
Compensation provided in forms other than cash — such as marketing support, co-op advertising funds, technology platform access, training, or other in-kind benefits from the carrier.
A catch-all category for compensation types that don’t fit the above categories, including unusual arrangements, barter, or carrier-specific compensation structures.
A single plan can report multiple fee types. When a broker receives different forms of compensation for the same coverage — such as a commission plus a consulting fee, or a commission plus an override — all fee types appear in the data. This matters for benchmarking, because two brokers with the same total compensation might have very different fee type compositions, which tells you different things about the structure of their relationships.
On Benefeature, broker fee types are searchable and filterable across every view. You can filter by fee type to find brokers who earn consulting fees, or identify carriers whose broker relationships include a high proportion of override fees. The fee type breakdown appears at the broker firm, agent, and employer plan levels, adding a layer of intelligence to the compensation data that goes beyond simple commission-versus-fee splits.
See the data in action
Explore broker compensation across four levels of detail with benchmarking, fee type breakdowns, and full search and filtering.
If you are a carrier, broker compensation data adds a dimension to market intelligence that has been effectively unavailable until now. This is not about policing comp rates — it is about understanding the landscape you operate in.
The carrier view shows your top broker relationships side-by-side with compensation data. You can see that your top broker earns a 7.4% average on your book while a similar relationship at a peer carrier shows 35.7%. That kind of comparison was previously impossible without extensive manual research. Do your own market research to see how your broker comp rates compare to competing carriers with similar relationships.
Compensation patterns are a signal. Understanding where comp is above or below market helps inform distribution strategy — not as a tactic, but as context for deeper conversations with your broker partners. When you can see how compensation is structured across your broker network, you have a more complete picture of the relationships that drive your business.
Compensation patterns vary by geography and industry. A carrier’s average broker comp rate in the Northeast may look very different from the same carrier’s rate in the Southeast — even for the same products. Seeing these patterns at scale adds a dimension to territory planning that was not previously available.
If you are a broker, access to compensation data changes the nature of several conversations you already have — with carriers, with employers, and with yourself about where you stand in the market.
The broker view shows your total commissions and fees, average rate, the commissions-versus-fees split, and a Compensation Benchmark flag — all in one place. For the first time, you can see whether your 10.0% average rate is “Normal” relative to comparable brokers, or whether it is flagged high or low. This is the kind of self-knowledge that was previously only available through anecdote and guesswork.
With ERISA scrutiny increasing, having data context on what is “normal” in your market helps you lead the conversation rather than react to it. The benchmark flag gives you a defensible, data-backed reference point. If a plan shows “Normal,” you can point to that as market validation. If it shows “Very High,” you have the context to understand why and address it proactively.
See how compensation varies across carriers, geographies, and products — not to game the system, but to have a clearer picture of the market you operate in. The broker view also shows your top carrier relationships with attributed premium and comp per carrier, giving you visibility into where your economics are concentrated.
At the individual plan level, the data shows the exact comp rate and benchmark flag for every employer you serve. This means you can review your entire book with compensation context built in — identifying plans where your rate is in line with the market and plans where it warrants a closer look, before anyone else raises the question.
See broker compensation data for yourself.
Search, filter, and benchmark broker comp across every Form 5500 filing.
If you are a benefits vendor, broker compensation data adds depth to how you think about distribution, partnerships, and market segmentation. Broker influence on employer purchasing decisions varies significantly by market — and compensation data helps you see where and how.
Broker compensation structures vary significantly by market and product line. Understanding these dynamics helps vendors think about distribution partnerships more clearly — where broker influence is highest, where compensation is concentrated, and how the economics of the broker channel differ across segments.
Compensation data adds a dimension to how you segment and prioritize markets. Where is broker influence highest? Where are compensation structures shifting? Which markets have compensation patterns that align with your distribution model? These questions are now answerable with data rather than intuition.
When evaluating broker partnerships, having context on how a broker’s compensation compares to their peers adds depth to the relationship. You can see their qualified book of business, their compensation benchmark, their carrier relationships, and their market presence — all before the first conversation.
Built for carriers, brokers, and vendors
See how each audience uses the Broker Compensation Intelligence page — with use-case breakdowns, search and filtering examples, and the full fee type taxonomy.
Broker compensation transparency is not a new concept. The data has been on Form 5500 filings for decades. But the ability to actually use that data — to search it, filter it, benchmark it, and understand the fee type composition behind it — is new. And the timing matters.
ERISA scrutiny is increasing. Employers are asking more questions about what they pay their brokers and whether those rates are in line with the market. Carriers are looking for better ways to understand their distribution economics. Brokers who can articulate where they stand relative to peers — and back it up with data — are better positioned than those who cannot.
The addition of fee type classification takes this further. Knowing that a broker earns $15 million in total compensation tells you something. Knowing that $10 million is commissions, $3 million is consulting fees, and $2 million is override fees tells you a lot more. It tells you about the structure of those relationships, the broker’s business model, and where their incentives are aligned.
Whether you are a carrier trying to understand how your broker comp rates compare to peer carriers, a broker preparing for a transparency conversation with an employer, or a vendor looking to understand the economics of broker partnerships in your target markets, this data is now structured and accessible in a way that it has never been before.
For more on how broker data is structured, see our guides on broker attribution and employee benefits benchmarking. For context on the growing regulatory relevance of compensation data, see our article on ERISA litigation and voluntary benefits.
See how broker compensation data is structured across four levels, with benchmarking, fee type breakdowns, and full search and filtering.
