The only platform that benchmarks broker comp rates, classifies 14 fee types, and makes it all searchable — from carrier level down to individual agent. Built for carriers, brokers, and vendors who need the full compensation picture, not a spreadsheet.
Trusted by carriers, brokers, and vendors across the industry
.png)
.png)
.png)
.png)

.png)

.png)
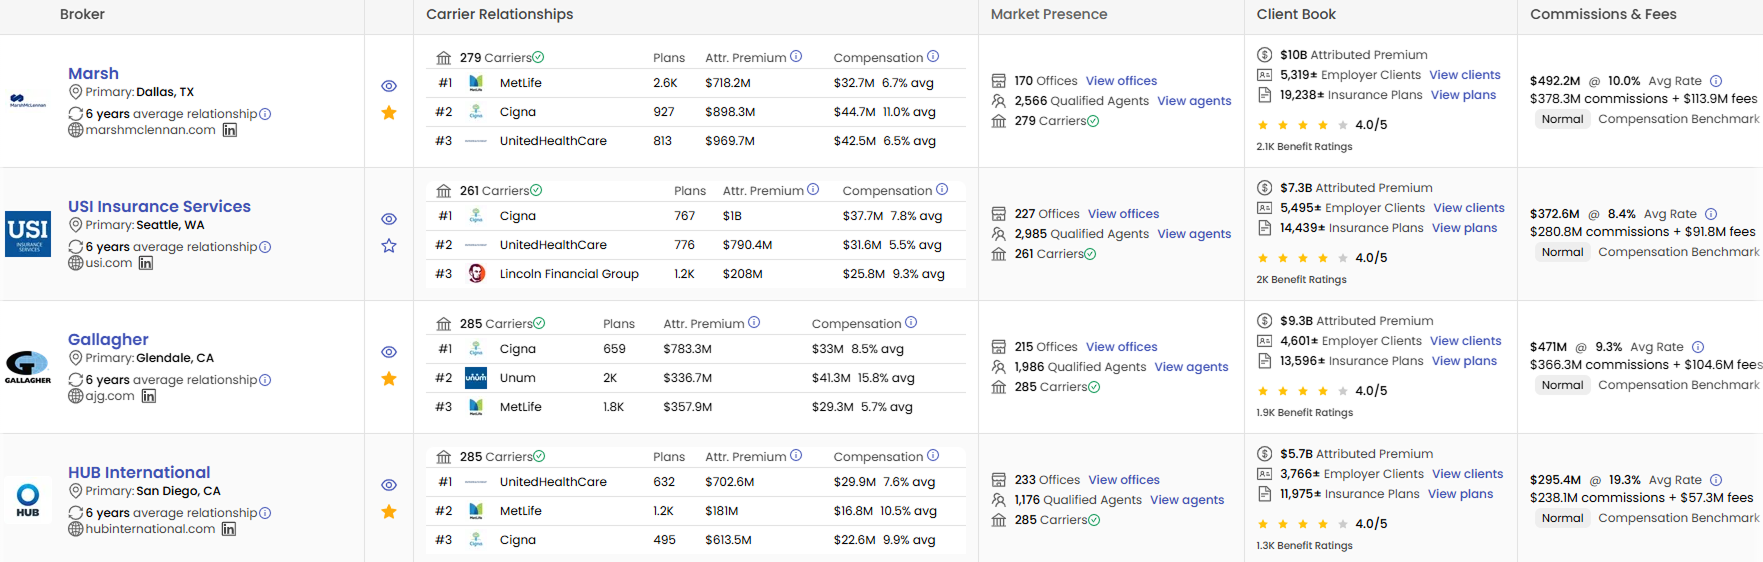
Drill from the carrier level all the way down to an individual employer plan. Compensation data, commission-versus-fee breakdowns, and benchmark flags appear at every level.
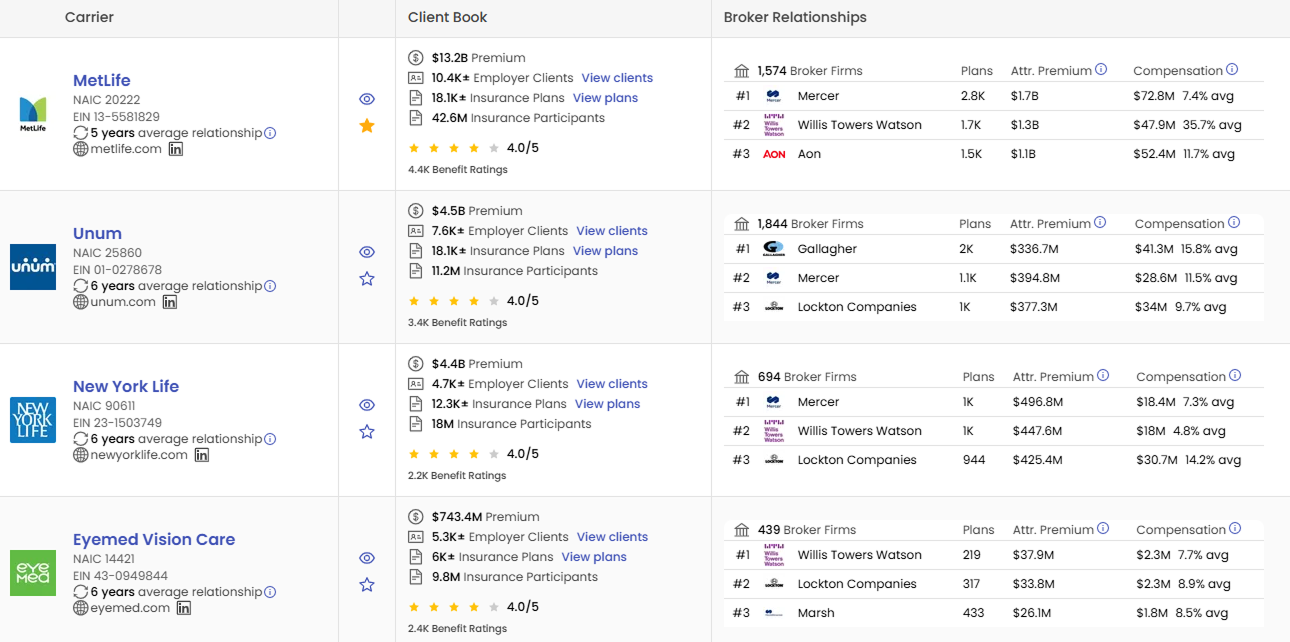
See a carrier’s top broker relationships ranked by plans, attributed premium, and total compensation. Compare average broker comp rates side-by-side across broker relationships within the same carrier.
Broker compensation is more than a single number. Form 5500 filings disclose different types of fees and compensation that brokers receive. Benefeature classifies these into 14 distinct fee types — each searchable and filterable across the platform.
Standard percentage of premium paid by the carrier for placing and servicing the plan.
Flat or percentage-based fee for ongoing account servicing, administration, or advisory services.
Additional commission above standard rate for performance targets or preferred agreements.
Carrier payment above standard commission, tied to firm performance or strategic partnership status.
Performance-based compensation tied to persistency, growth, or profitability targets.
Compensation conditional on future events — retention thresholds, volume targets, or other metrics.
Fees for marketing, distribution, or promotional activities, especially in voluntary product lines.
Fee paid to a GA or MGA for recruiting and managing a network of sub-agents or brokers.
Third Party Administrator fees for claims administration or plan management.
Fees for technology services like benefits portals, enrollment platforms, or analytics tools.
Strategic consulting, plan design, vendor evaluation, or actuarial analysis beyond standard brokerage.
Fee paid between brokers or entities for referring business or clients.
In-kind benefits like marketing support, platform access, training, or co-op advertising funds.
Catch-all for compensation types outside standard categories, including unusual or carrier-specific structures.
A single plan can report multiple fee types. When a broker receives different forms of compensation for the same coverage — such as a commission plus a consulting fee — both appear in the data. Benefeature surfaces the full fee type breakdown at the broker firm, agent, employer plan, and carrier levels.
Raw numbers alone do not tell you much. A broker earning $15.7 million in compensation sounds like a lot, but is it? Relative to their book size, market, and peer group, it might be perfectly normal.
Benefeature benchmarks every broker compensation rate against comparable plans and flags each on a five-level scale. The benchmark considers employer size, geography, industry, and product mix.
The benchmark is context, not judgment. A “Very High” flag does not mean something is wrong. It means the rate is statistically above the peer group average. The flag gives you the starting point for a conversation, not the conclusion.
Compensation Benchmark Distribution
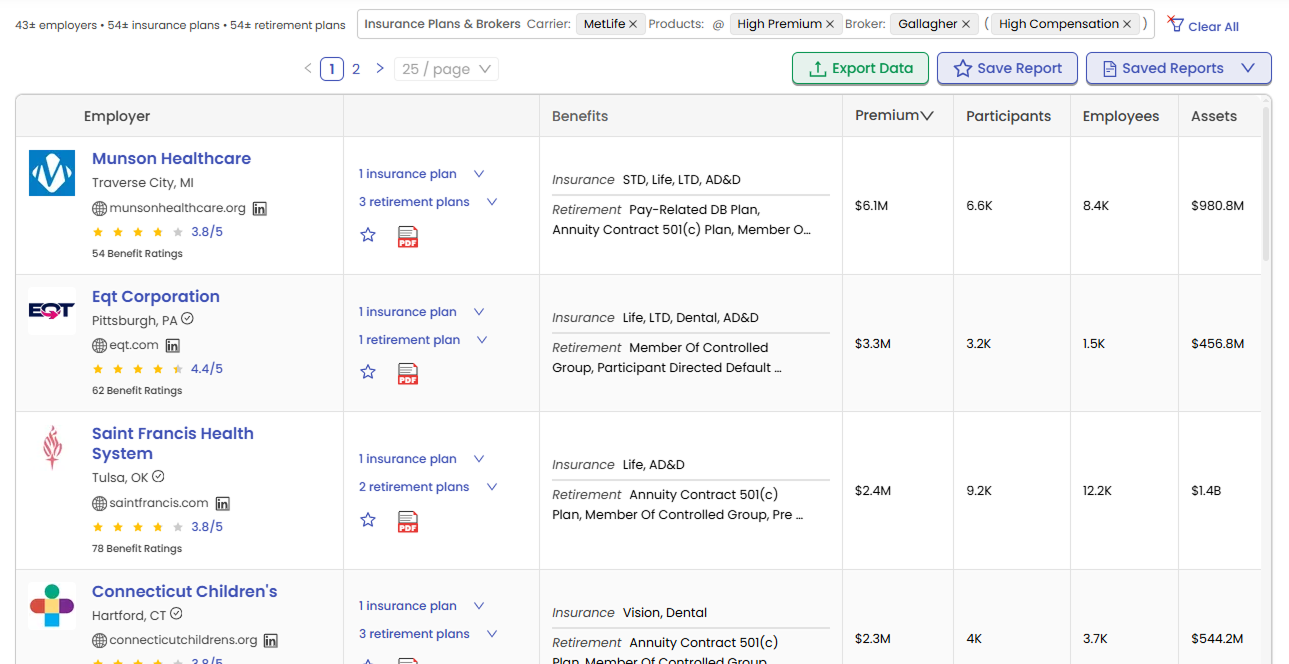
Broker compensation data on Benefeature is not a static report. It is a living dataset you can query from any angle. Search for a specific broker, filter by geography, drill into a carrier’s compensation patterns, or find employers where broker comp rates are flagged high.
Three audiences, three different jobs on the same compensation dataset.
Search, filter, and benchmark broker comp across every level — from carrier to individual agent — with fee type breakdowns and compensation benchmarking built in.
