You just got back from the sales conference. Leadership wants $ in new revenue this year. Here is a practical way to find where employers and employees are underserved, bring them real solutions, and tie that work to your revenue target using AskGMS market data and Benefeature employer and broker intelligence. You can build the plan in a single day.
Methodology by Cliff Murch
It is a familiar situation for any sales leader, territory manager, or regional VP in group benefits: leadership sets an ambitious revenue target. Maybe it is a $10,000,000 increase across your region. Maybe it is a territory goal or a per-rep number that has to roll up.
The hard part is specificity. How do you break a large number into concrete strategies? How do you assign realistic assumptions to each one? And how do you know the market can support them?
AskGMS and Benefeature answer those questions together. AskGMS gives you sold case data by product, size band, and territory. Benefeature gives you employer and broker intelligence so you can understand needs before you reach out. Used together, they turn market data into a sales plan you can build in days.
Revenue = Number of Entities × Lines of Coverage × Premium per Line
The Sales Goal Planner expands this into brokers, employers, eligible lives, participation %, and premium per life when you want finer control.
The “entities” vary by strategy: new broker partners, existing partners with room to grow, employers with retirement plan signals, or employers missing supplemental health coverage. The article models up to 3 lines of coverage per entity. Premium per line comes from market benchmarks.
The $32.5K premium-per-line assumption is conservative for core products. AskGMS sold case data shows average premium per plan for 100–499 life employers between $28,000 and $63,000 depending on product, or about $250 per life on a 130-life case. Voluntary supplemental lines use a lower effective premium per line where participation runs closer to 20%.
Adjust every assumption to match your territory in the interactive Sales Goal Planner.
Already use AskGMS or Benefeature? Open AskGMS · Log in to Benefeature
New to either platform? Contact sales · Book a walkthrough
Develop relationships with 16 productive brokers in your territory who are not currently appointed with you. Model 3 lines of coverage at $32.5K/line (~$250/life on a 130-life case).
Model this strategy in the plannerAskGMS: Identify top-producing brokers in your territory who are not writing with you, and understand their market focus and placement patterns. Benefeature: Search broker agents by territory, review books of business and employer relationships, and identify partners whose client base aligns with coverage needs you can address.
Start here to see who is writing business in your territory and with which carriers.
A wider window shows sustained production, not only a recent win. Brokers who have placed business consistently over several years tend to be reliable partners.
Filter to the core lines you sell so you are talking to brokers whose clients already buy that type of coverage.
These brokers are already winning in your territory. They have relationships and deal flow. They may simply have not been introduced to your products yet.
AskGMS shows placement patterns. Benefeature adds their employer book and coverage gaps. Walk in with something specific about their clients.
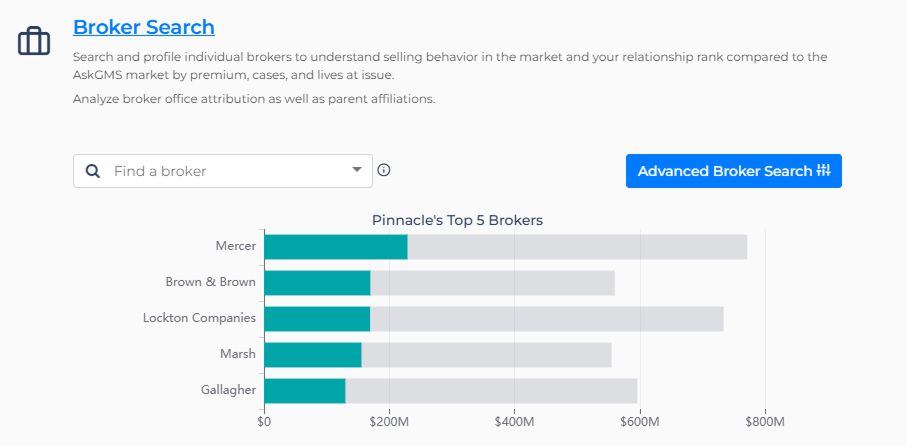
AskGMS Broker Search (AskGMS subscribers)
Work with 10 existing brokers whose placement with you trails their overall market activity, help them identify gaps in their employer portfolios where additional lines could better serve their clients, and model growth to the block average as 3 lines at $32.5K each.
Model this strategy in the plannerAskGMS: Compare each broker's placement patterns with market benchmarks to spot opportunities where their clients may be underserved relative to similar employers. Benefeature: View broker-level books of business, identify employers they serve who have coverage gaps, and build targeted consultation plans around employer needs.
Find brokers who are appointed with you but writing less with you than their overall market activity suggests.
A multi-year view shows real production trends. You want brokers who win business consistently, even if their share with you is lower than it could be.
Stay on core lines so you can compare like for like across the market.
A broker placing 15% of business with you when peers average 30% usually has not had a reason to shift more volume your way. That gap is the opportunity.
Keep targets modest: a small share increase across several brokers adds up without asking anyone to rebuild their book.
Plug the numbers into the Sales Goal Planner so this strategy rolls up to your territory target.
Use AskGMS for placement patterns, then Benefeature to see which employers they serve and where those employers have coverage gaps. That is your opening for the conversation.
AskGMS Broker Profile (AskGMS subscribers)
Find 20 lines of coverage to add for inforce employers who are missing benefit lines their workforce may need. Model $32.5K/line.
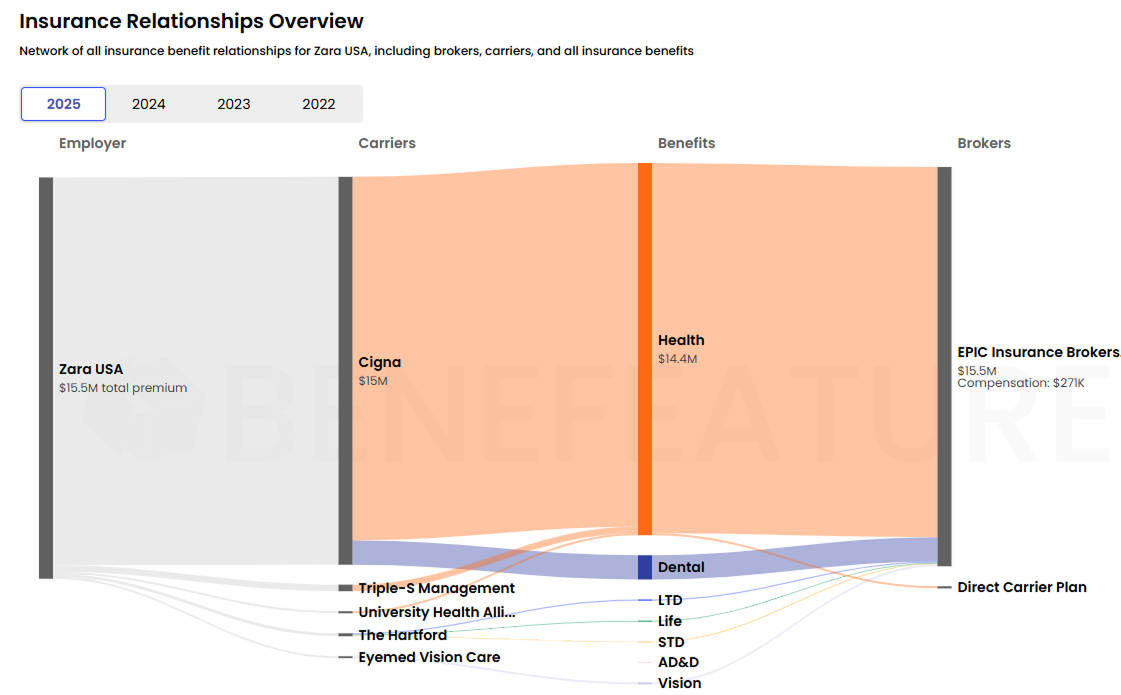
Model this strategy in the plannerAskGMS: Benchmark your inforce employers against market data to flag coverage gaps by product line relative to similar employers in their industry and size band. Benefeature: Search inforce employers, flag gaps in their benefits lineup, and prioritize by which workforces would benefit most from additional coverage.
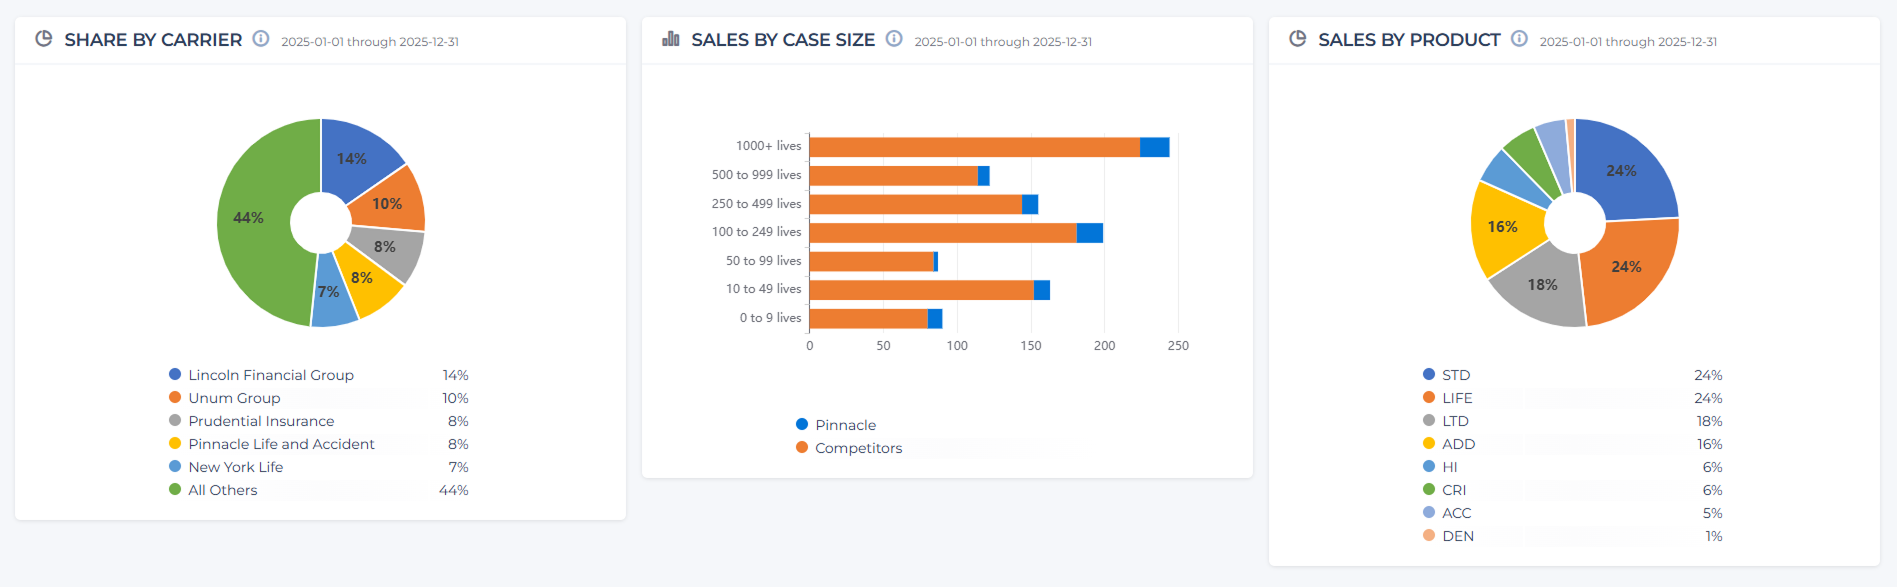
Start with employer-level coverage: what they carry, who the carriers are, and what is missing.
Keep the list focused on the geography and employer size where your products and pricing are strongest.
The column export lays out each employer's lineup side by side so you can scan for missing lines or carriers you can compete against.
These are high-value targets. The employer already buys the product. Your pitch is how you can serve the workforce better, backed by data on their current lineup.
Benefeature employer search with filters (Benefeature subscribers)
Give 25 strong broker partners territory data they can use in employer conversations. Model 3 new lines at $32.5K each.
Model this strategy in the plannerAskGMS: Pull territory-level market data by product line and employer size. Benefeature: Build employer lists by geography, industry, and coverage gap for brokers to work from.
Pick one or two brokers per rep who have the right relationships and appetite to grow. Depth beats breadth here.
Profiles show placement patterns and production trends so you can see who has the deal flow to use the data you provide.
Bring brokers ready-made lists: employers in their territory with specific coverage needs, filtered by industry and size. That makes you useful before you ask for anything in return.
Plan design benchmarks show how similar employers structure benefits. Give brokers comparison data to bring into employer meetings.
AskGMS Plan Design Benchmarking (AskGMS subscribers)
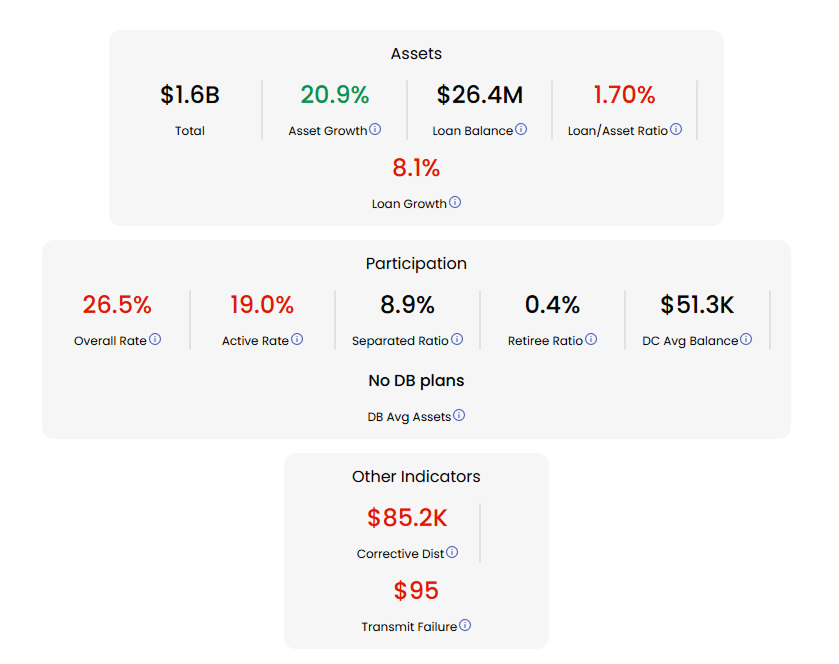
Focus on 15 employers with high 401(k) loan rates, a common signal of financial stress and often of weak supplemental health coverage. Model 3 lines at $32.5K/line.
Model this strategy in the plannerBenefeature: Filter by retirement plan KPIs (loan activity, participation, hardship withdrawals), review benefits alongside plan data, and find where supplemental coverage would help employees who are already borrowing against retirement.
High loan rates often mean employees lack safety-net coverage. Supplemental health products fill part of that gap.
Work through the broker of record with a concrete insight about the client's workforce.
Many brokers do not connect retirement loan activity to supplemental health needs. A short flyer explains the link to Accident, Critical Illness, and Hospital Indemnity.
Some employers have no supplemental coverage. Others have partial or outdated plans. Both are viable targets.
Show how the client's supplemental plan compares to similar employers. Keep the conversation on employee protection as well as premium.
Benefeature retirement plan KPI filters (Benefeature subscribers)
Find 100 employers where employees lack Accident, Critical Illness, and Hospital Indemnity coverage, or carry it in fragmented form. Model 3 lines at $6.5K/line (20% voluntary participation).
Model this strategy in the plannerAskGMS: Size the supplemental health opportunity in your territory using sold case data to understand adoption patterns and identify where coverage is most needed. Benefeature: Filter for employers missing supplemental health products, understand their current benefits landscape, and prioritize by workforce size and industry to reach the employees who need it most.
Same starting point as Strategy 5, but skip employers with high loan activity so you do not double-count pipeline.
Go through the broker of record with specific intelligence about the client's benefits gaps.
Some employers have no supplemental products. Others have Accident from one carrier and nothing else. A bundled approach can simplify administration and improve protection.
Benchmarking shows how peers structure supplemental coverage, which gives brokers something concrete to bring into the employer meeting.
Benefeature employer overview (Benefeature subscribers)
Find 15 employers whose workforce lacks foundational STD, LTD, or Life coverage. Model 1 line at $32.5K/line.
Model this strategy in the plannerAskGMS: Benchmark STD, LTD, and Life adoption rates by territory and size band to find where core coverage is most absent and the need is greatest. Benefeature: Filter for employers with unbundled or missing core benefits, review their workforce demographics, and prioritize by where employees would benefit most from foundational protection.
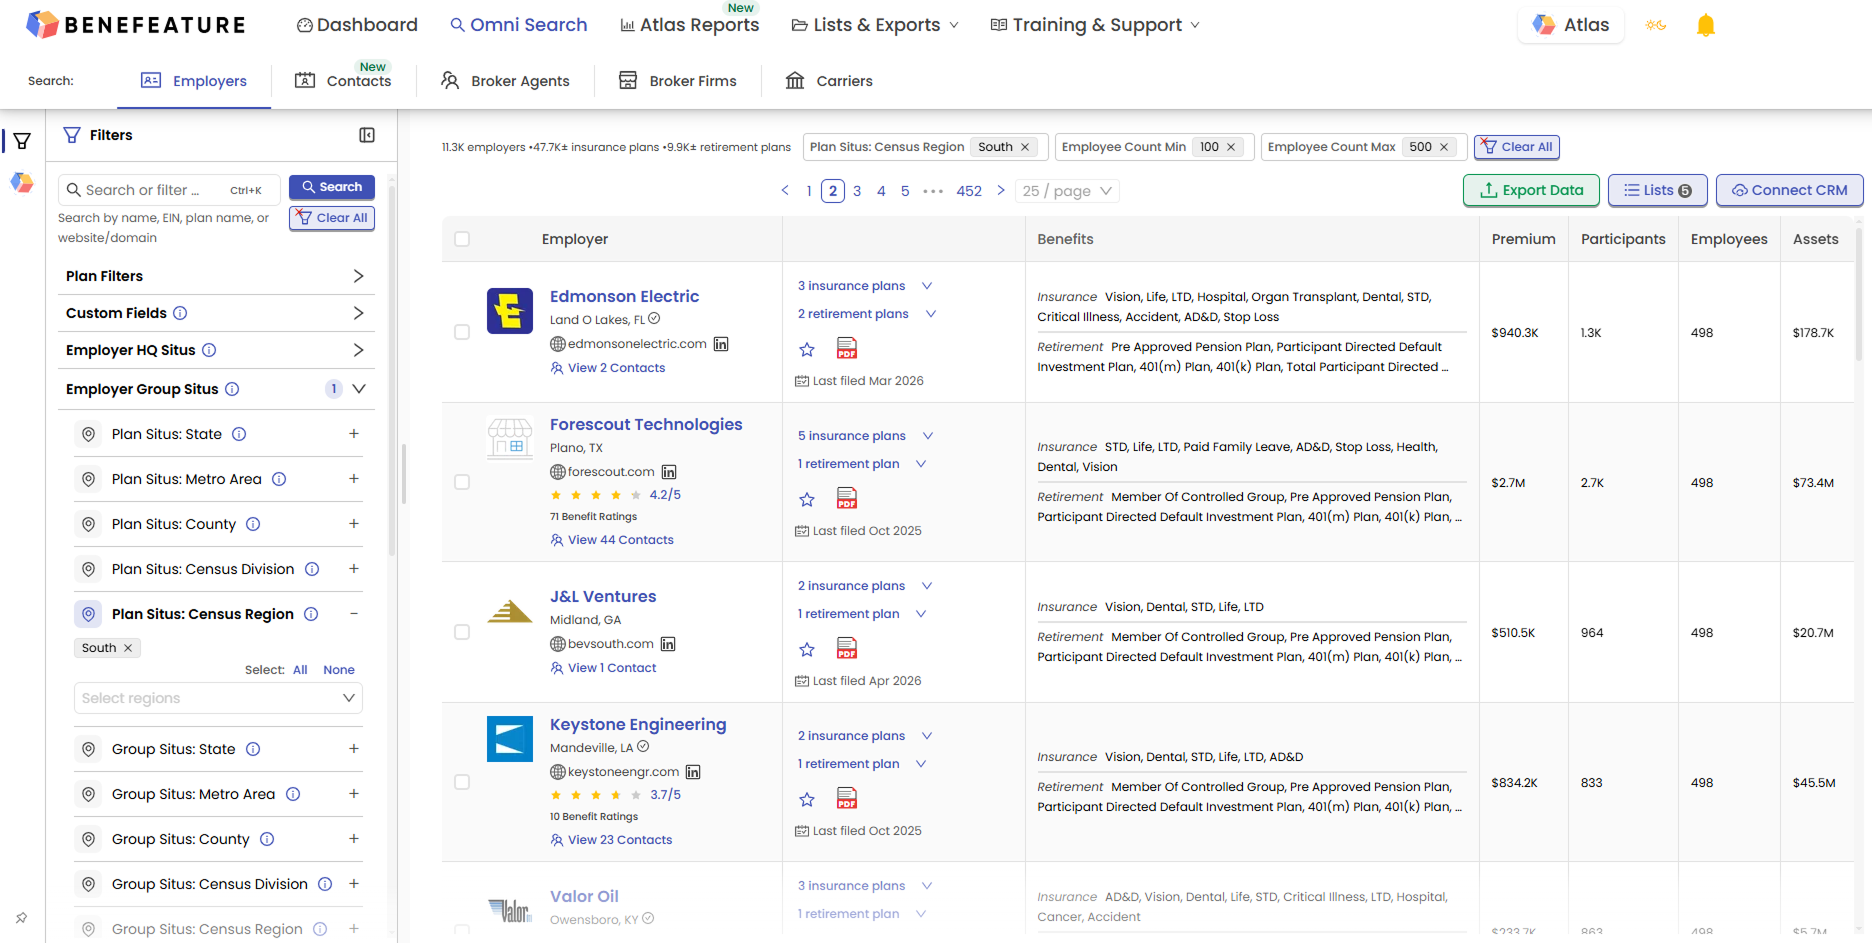
Search employers by what they carry today and, more importantly, what is missing from the lineup.
Mid-market employers often have core-benefit gaps that larger employers have already closed. Focus where your STD, LTD, and Life products are competitive.
Scan the export for missing STD, LTD, or Life lines across your target list.
Employers spread across several carriers may be open to a cleaner, consolidated core-benefits package.
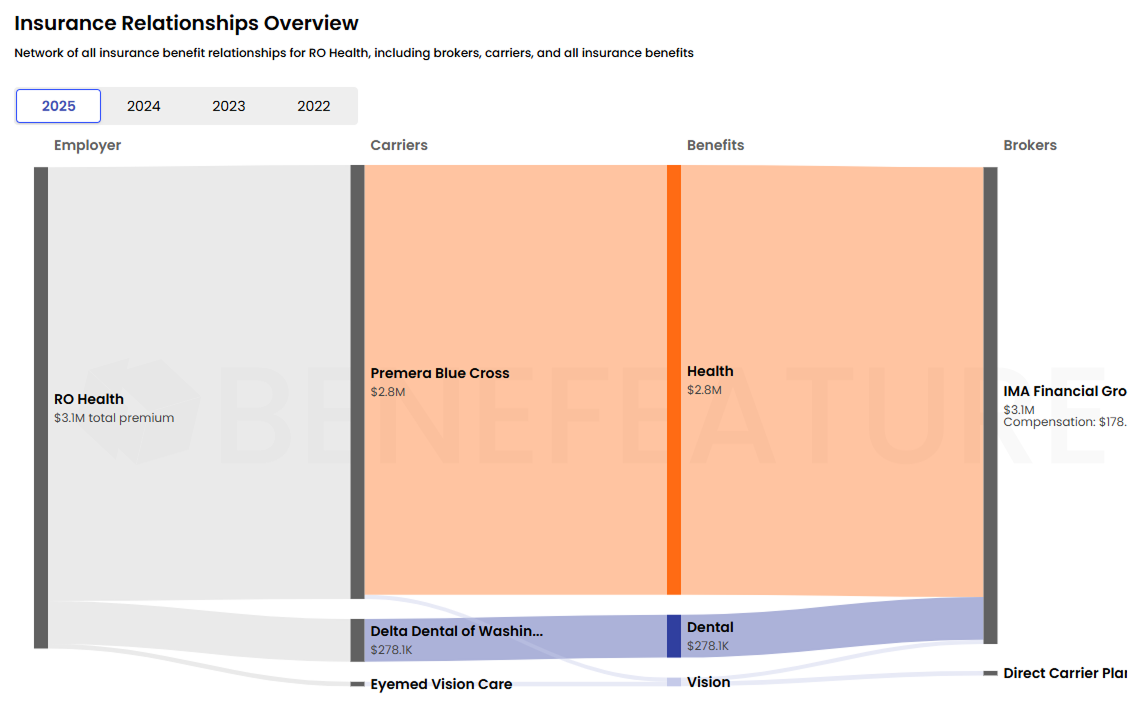
Benefeature employer benefits overview (Benefeature subscribers)
Target 15 employers in segments where your STD, LTD, or Life sold rates are competitive but your share is still low. Model 1 line at $32.5K/line.
Model this strategy in the plannerAskGMS: Analyze sold rate trends by territory and product line to identify markets where your rates are favorable relative to competitors but penetration is below average. Benefeature: Filter for employers in those markets, review their current carrier mix and benefits landscape, and prioritize outreach to employers most likely to benefit from a competitive alternative.
AskGMS sold case data shows where your rates win but share lag. Those segments are worth prioritizing.
Filter by industry, size, and territory to build a list of employers that fit the profile and need the coverage.
Lead with rate competitiveness in that segment and name specific employers where their clients could save money.
.png)
AskGMS Rate Analysis (AskGMS subscribers)
| Strategy | Revenue | Assumptions |
|---|---|---|
| Build New Broker Partnerships | $1,560,000 | 16 brokers × 3 lines × $32.5K |
| Strengthen Existing Broker Relationships | $975,000 | 10 brokers × 3 lines × $32.5K |
| Close Coverage Gaps for Current Clients | $650,000 | 20 lines × $32.5K |
| Equip Broker Partners with Market Intelligence | $2,437,500 | 25 brokers × 3 lines × $32.5K |
| Identify Financially Stressed Workforces | $1,462,500 | 15 employers × 3 lines × $32.5K |
| Address Unmet Supplemental Health Needs | $1,950,000 | 100 employers × 3 lines × $6.5K (20% participation) |
| Expand Core Benefits for Underserved Employers | $487,500 | 15 employers × 1 line × $32.5K |
| Win Core Benefits Where Sold Rates Favor You | $487,500 | 15 employers × 1 line × $32.5K |
| Total | $10,010,000 |
These numbers are just the starting point.
Adjust every assumption to match your territory in the interactive planner.
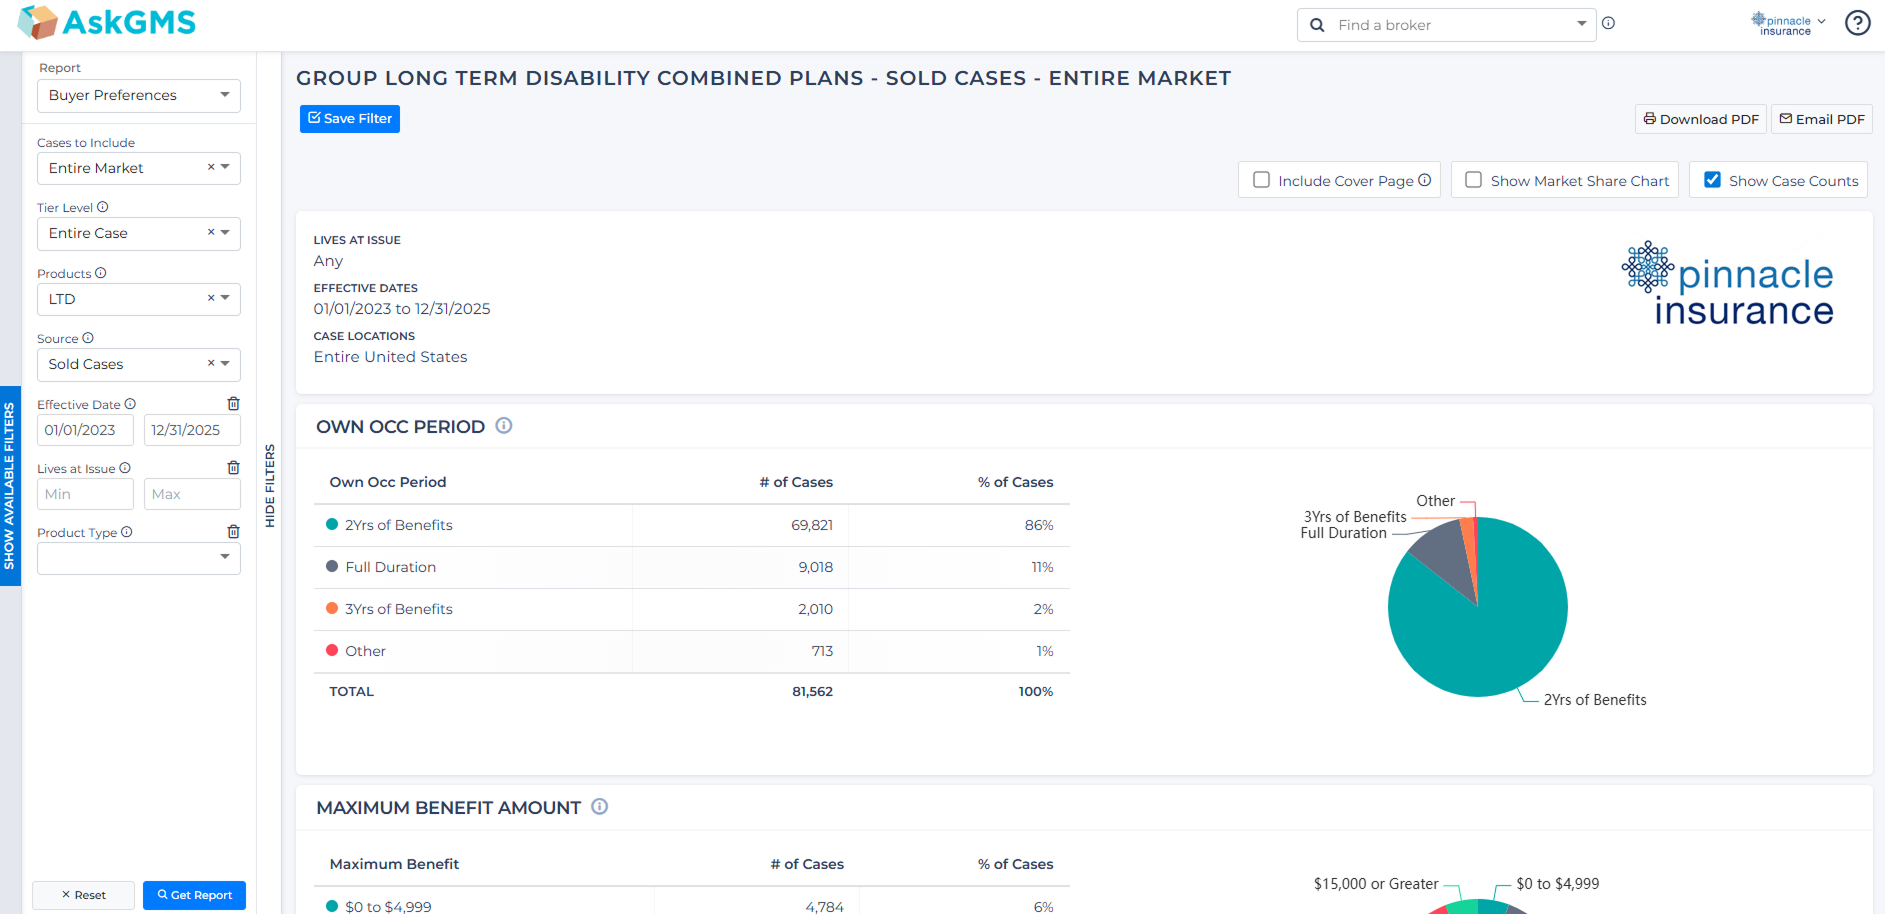
The $32,500 premium-per-line figure (about $250 per life on a 130-life case) comes from AskGMS sold case data reported by top group insurance carriers.
For 100 to 499 life employers, average premium per plan by product line looks like this:
Most lines meet or beat $32.5K in this segment. Accident runs lower ($28K) but LTD ($55K) and STD ($63K) pull the average up. Blended, the market runs about $191/life for 100–499 employers, so $250/life is a reasonable planning target for core products. Larger employers skew higher. Planning at $32.5K per line keeps the model defensible in review.
Tie every number in the plan to market data. When leadership asks where assumptions came from, point to AskGMS sold case benchmarks. When they ask how you will execute, point to broker lists, employer gaps, and intelligence packages in Benefeature.
The Sales Goal Planner includes the full AskGMS benchmark dataset (7 product lines across 4 employer size bands) so you can check every assumption against real market data.
Cliff Murch developed the eight-strategy methodology. He is Founder of Insight-360 and former leader at Lincoln Financial Group and Unum. Cliff uses the same approach with his clients.
Here is how to get started:
Input your sales goal, adjust the assumptions for each strategy, and see the AskGMS benchmark data that backs it all up.
Open the PlannerWritten by
Ian Ryan is Director of Marketing Strategy & Analytics at AskGMS and Benefeature. He drafted this article and built the interactive Sales Goal Planner that turns Cliff Murch's framework into something teams can use in the field.
Connect on LinkedInMethodology by
Cliff Murch is the Founder of Insight-360, a business intelligence consulting firm committed to helping employee benefits brokers, carriers, and data providers maximize profitable growth through market-tested strategies.
With 30+ years in group benefits, including leadership at Lincoln Financial Group and Unum, Cliff brings deep expertise in national sales, distribution strategy, and market intelligence. He uses the AskGMS and Benefeature integration to develop data-driven sales strategies for his clients, turning quantitative market insights into actionable plans that drive real results.
